What is business intelligence: a 2026 guide for decisions

Many professionals mistake business intelligence for just another reporting tool, but it’s actually a strategic framework that transforms raw data into competitive advantage. Understanding what BI truly encompasses can revolutionize how your organization makes decisions, from daily operations to long term planning. This guide breaks down BI’s core components, explains how it drives smarter choices, and provides practical insights for implementing BI successfully in your business today.
Table of Contents
- Understanding Business Intelligence: Definition And Scope
- Key Components And Technologies Of Business Intelligence
- How Business Intelligence Drives Data-Driven Decision Making
- Challenges And Best Practices For Implementing Business Intelligence
- Explore TechMoths Resources To Enhance Your Business Intelligence Journey
Key takeaways
| Point | Details |
|---|---|
| BI definition | Business intelligence transforms raw data into actionable insights through integrated processes and technologies. |
| Core components | BI systems combine data warehouses, ETL processes, analytics tools, and visualization dashboards. |
| Decision support | BI enables evidence-based choices by providing timely, accurate insights across all business functions. |
| Implementation challenges | Data quality, user adoption, and integration complexity require careful planning and ongoing support. |
| 2026 advantages | Cloud-based BI and AI-enhanced analytics make powerful insights accessible to organizations of all sizes. |
Understanding business intelligence: definition and scope
Business intelligence represents far more than generating reports from your database. At its core, BI encompasses tools, processes, and methodologies that transform raw data into meaningful information your team can actually use. Think of BI as the bridge between the numbers sitting in your systems and the strategic decisions that move your business forward.
The scope of BI extends across your entire organization. It includes collecting data from multiple sources, storing it efficiently, analyzing patterns and trends, and sharing insights with stakeholders who need them. Unlike traditional reporting that simply shows what happened last quarter, BI helps you understand why it happened and what might happen next.
Modern BI platforms integrate data from sales systems, customer databases, financial software, and operational tools into a unified view. This integration eliminates the silos that plague many organizations, where marketing doesn’t know what sales knows, and finance operates in its own bubble. BI breaks down these barriers by creating a single source of truth everyone can access.
The real power of BI lies in enabling evidence-based decision making rather than gut feelings or outdated assumptions. When your team can visualize customer behavior patterns, identify operational bottlenecks, or forecast demand accurately, they make choices that directly impact your bottom line. BI supports both tactical decisions, like adjusting inventory levels, and strategic planning, like entering new markets.
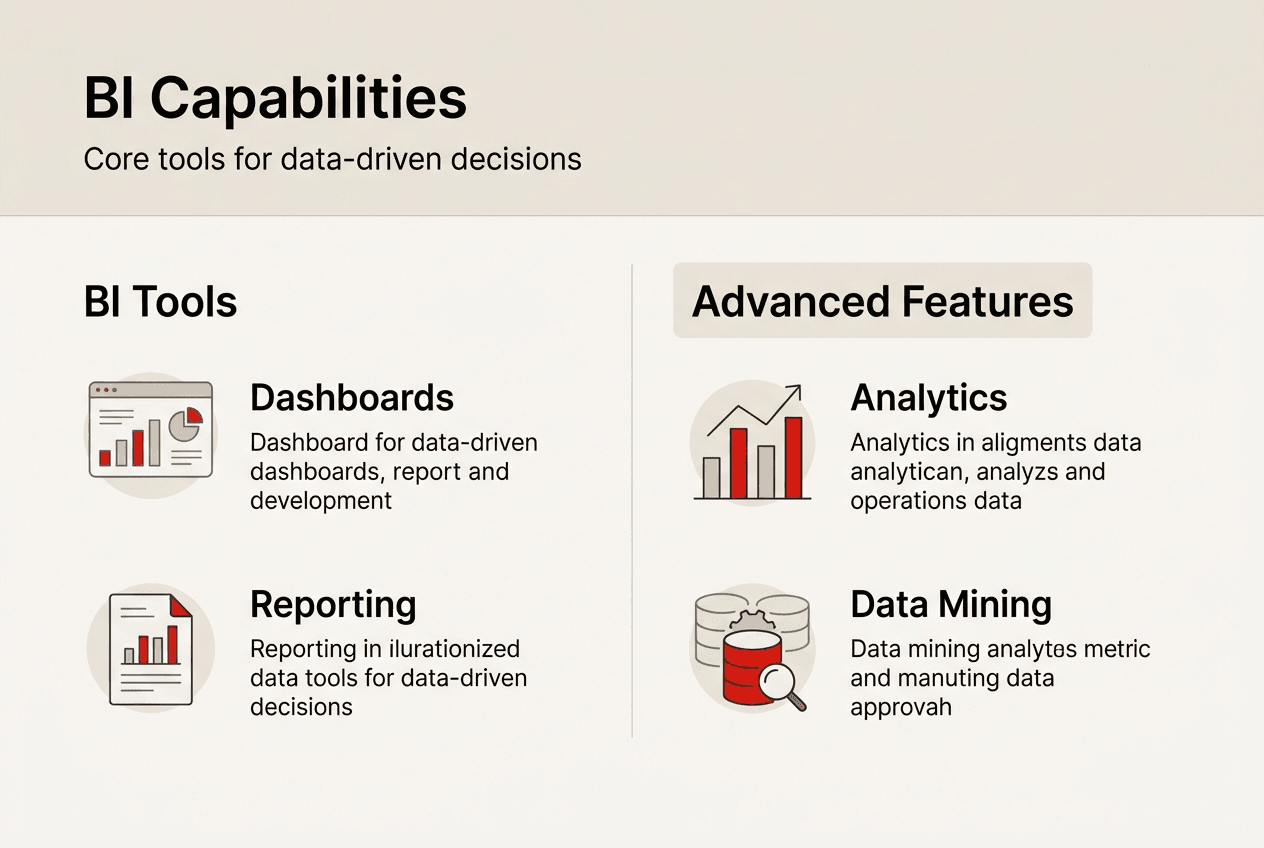
Common BI capabilities include interactive dashboards, ad hoc reporting, predictive analytics, and data mining. These tools help users at every level, from executives reviewing KPIs to analysts digging into granular details. The technology continues evolving, with AI and machine learning now enhancing pattern recognition and forecasting accuracy.
Pro Tip: Treat BI as an ongoing capability, not a one-time project. The most successful implementations align BI initiatives with specific business goals and evolve as those goals change.
Key components and technologies of business intelligence
Effective BI systems rely on several integrated components working together seamlessly. Understanding these building blocks helps you evaluate solutions and plan implementations that actually deliver value.
Data sources form the foundation, pulling information from transactional databases, CRM systems, ERP platforms, spreadsheets, and external feeds. Modern BI architectures consolidate these disparate sources into centralized repositories. Data warehouses store historical information optimized for analysis rather than transaction processing, while data marts serve specific departments or functions.
ETL processes (extract, transform, load) move data from source systems into warehouses, cleaning and standardizing it along the way. This transformation ensures consistency, like converting all dates to the same format or reconciling different product codes across systems. Without solid ETL, your analytics build on shaky foundations.
| Component | Primary Purpose | Key Benefit |
| Data warehouse | Centralized storage for historical data | Single source of truth across organization |
| ETL tools | Data extraction and transformation | Ensures data quality and consistency |
| OLAP cubes | Multidimensional analysis | Fast query performance for complex analysis |
| Dashboards | Visual data presentation | Real-time insights accessible to all users |
| Predictive analytics | Forecasting and modeling | Anticipates trends before they emerge |
Analytics software processes the stored data, running queries and calculations that would overwhelm operational systems. OLAP (online analytical processing) cubes enable multidimensional analysis, letting users slice data by time, geography, product line, or any other dimension. This flexibility supports the exploratory analysis that uncovers hidden opportunities.

Visualization dashboards present insights through charts, graphs, and interactive displays that make complex data digestible. Good dashboards highlight exceptions and trends automatically, so users don’t wade through endless tables hunting for meaningful patterns. The best tools let business users create their own views without IT intervention.
Cloud BI solutions have transformed accessibility in 2026, eliminating the infrastructure costs and complexity of on-premises systems. Organizations now deploy essential business tools that scale with demand and update automatically. Cloud platforms also facilitate collaboration, letting distributed teams work from the same data simultaneously.
AI and machine learning now enhance BI capabilities by automating pattern detection, generating natural language insights, and improving forecast accuracy. These technologies identify anomalies humans might miss and suggest next best actions based on historical patterns. Self-service BI empowers business users to answer their own questions without waiting for IT to build custom reports.
The key technologies you’ll encounter include:
- Data warehouses and data lakes for storage
- ETL and data integration platforms
- OLAP engines for multidimensional analysis
- Reporting and dashboard tools
- Predictive analytics and machine learning models
- Mobile BI apps for on-the-go access
How business intelligence drives data-driven decision making
BI’s true value emerges when it transforms how your organization makes decisions at every level. The process moves through clear stages that convert raw data into concrete actions.
First, data acquisition pulls information from all relevant sources, capturing transactions, customer interactions, operational metrics, and external market data. Modern systems automate this collection, ensuring freshness without manual intervention. The breadth of data captured determines the insights available later, so comprehensive collection pays dividends.
Next, processing and integration clean the data, resolve inconsistencies, and combine information from different systems. This stage handles the messy reality of real-world data, like customers entered slightly differently across systems or transactions recorded in various formats. Quality processing prevents the garbage in, garbage out problem that undermines trust in analytics.
Analysis applies statistical methods, algorithms, and business logic to identify patterns, trends, and relationships. Analysts might discover that customers who buy product A typically purchase product B within 30 days, or that service calls spike predictably after certain weather events. These insights reveal opportunities and risks hiding in the numbers.
Insight generation translates analytical findings into business context. Raw correlations become actionable recommendations, like adjusting inventory levels, targeting specific customer segments, or reallocating marketing spend. The best BI systems present insights proactively, alerting decision makers to situations requiring attention rather than waiting for someone to ask the right question.
Decision execution puts insights into action through operational changes, strategic initiatives, or tactical adjustments. A retailer might modify pricing based on demand forecasts, while a manufacturer optimizes production schedules using predictive maintenance data. BI shortens the cycle from insight to action, creating competitive advantage.
Outcome evaluation closes the loop by measuring results and feeding learnings back into the system. Did the pricing change improve margins? Did the production optimization reduce downtime? Tracking outcomes validates BI value and refines future models.
Real-world applications span every business function. Marketing teams optimize campaigns by analyzing customer response patterns and digital engagement metrics. Supply chain managers reduce costs by forecasting demand more accurately and identifying bottlenecks. Finance departments improve budgeting through better visibility into spending patterns and revenue drivers.
Pro Tip: Regularly update your BI data inputs and validate insights against business reality. Even sophisticated models drift when conditions change, so continuous calibration maintains reliability.
BI supports continuous improvement by making performance visible and highlighting gaps between goals and actuals. When everyone sees the same metrics, accountability increases and teams align around shared objectives. This transparency accelerates learning and adaptation in fast-changing markets.
Leadership support and data literacy multiply BI benefits exponentially. Organizations that invest in training users and fostering data-driven culture extract far more value than those treating BI as just another IT system. When people throughout the organization ask for data before making decisions, BI delivers its full potential.
Challenges and best practices for implementing business intelligence
Despite BI’s clear benefits, implementations often stumble over predictable obstacles. Understanding these challenges helps you avoid common pitfalls and accelerate time to value.
Data silos rank among the most persistent problems, with information trapped in departmental systems that don’t communicate. Sales data lives in the CRM, financial data in the ERP, and customer service data in yet another platform. Breaking down these silos requires both technical integration and organizational alignment around shared data standards.
Poor data governance undermines BI before it starts. Without clear ownership, quality standards, and stewardship processes, data degrades quickly. Duplicate records multiply, definitions drift across departments, and nobody trusts the numbers enough to base decisions on them. Establishing governance early prevents these issues from compounding.
Lack of training leaves users unable to leverage BI tools effectively. Even intuitive interfaces require some learning, and analytical thinking doesn’t come naturally to everyone. Organizations that skimp on training end up with expensive systems that sit unused while people revert to spreadsheets and gut feelings.
Cultural resistance poses perhaps the biggest barrier. People comfortable with existing processes resist change, especially when it threatens established power structures or exposes performance gaps. Overcoming this resistance requires demonstrating quick wins and involving skeptics in the implementation process.
Practical best practices for successful BI adoption:
- Secure executive sponsorship to ensure resources and organizational support
- Start with focused pilot projects that deliver quick wins and build momentum
- Invest in comprehensive user training tailored to different roles and skill levels
- Define clear KPIs that align BI initiatives with business objectives
- Establish data governance policies before scaling across the organization
- Provide ongoing support through help desks and power user networks
- Iterate based on user feedback rather than pursuing perfect solutions
| Common Pitfall | Recommended Strategy |
|---|---|
| Trying to solve everything at once | Phase rollout with focused use cases that deliver measurable value |
| Ignoring data quality issues | Implement data governance and quality checks before scaling |
| Technology-first approach | Start with business questions, then select tools to answer them |
| Insufficient user involvement | Include end users in design and testing to ensure practical fit |
| Lack of executive support | Demonstrate ROI early and maintain visible leadership engagement |
Aligning BI initiatives with specific business objectives keeps projects focused and measurable. Rather than implementing BI for its own sake, tie efforts to concrete goals like reducing customer churn, improving forecast accuracy, or accelerating product development cycles. This alignment makes value obvious and sustains investment.
Fostering a data-driven culture requires consistent messaging from leadership and celebrating wins that result from BI insights. When executives reference dashboards in meetings and reward decisions backed by data, the organization follows suit. Culture change takes time but multiplies BI impact across every function.
Involving end users early in the process ensures tools meet practical needs rather than theoretical requirements. Users provide invaluable feedback on workflows, report designs, and feature priorities. Their buy-in also smooths adoption when systems go live.
Explore TechMoths resources to enhance your business intelligence journey
Now that you understand what business intelligence is and how it drives better decisions, you’re ready to deepen your expertise and apply these concepts in your organization. TechMoths offers comprehensive resources that complement your BI journey and support professional growth.
Our professional growth strategies help you develop the analytical mindset and leadership skills that maximize BI impact. We also provide detailed guides on enterprise analytics and business strategy that show how to align data initiatives with organizational goals. For practical implementation support, explore our coverage of essential business tools that integrate with BI platforms to streamline operations and improve decision quality across your team.
Frequently asked questions
What is the difference between business intelligence and data analytics?
Business intelligence focuses on collecting, organizing, and presenting data to support operational and strategic decisions through dashboards and reports. Data analytics emphasizes deeper statistical analysis, predictive modeling, and uncovering hidden patterns in data. While BI answers what happened and why, analytics often predicts what will happen and prescribes actions. Both disciplines overlap significantly and complement each other in modern data-driven organizations.
How can small businesses benefit from business intelligence tools?
Small businesses gain competitive advantages through BI by understanding customer behavior, optimizing inventory, and identifying profitable opportunities without enterprise budgets. Cloud-based BI platforms in 2026 offer affordable, scalable solutions that eliminate infrastructure costs and technical complexity. These tools help small teams make data-informed decisions about marketing spend, product development, and resource allocation. Even basic BI implementations provide visibility that improves efficiency and reveals growth opportunities previously hidden in spreadsheets.
What are key challenges to expect when implementing business intelligence?
Expect hurdles around data quality, with inconsistent or incomplete information undermining analytical accuracy and user trust. User adoption challenges arise when people resist new workflows or lack training to use BI tools effectively. Integration difficulties occur when connecting disparate systems and reconciling different data formats. Cultural resistance emerges when BI threatens established practices or power structures. Successful implementations address these challenges through careful planning, executive support, comprehensive training, and phased rollouts that demonstrate value quickly.
How long does it take to implement a business intelligence system?
Implementation timelines vary dramatically based on organizational size, data complexity, and scope. Focused pilot projects targeting specific use cases can deliver value in 4 to 8 weeks, while enterprise-wide deployments might take 6 to 12 months or longer. Cloud-based solutions typically deploy faster than on-premises systems by eliminating infrastructure setup. The key is starting with manageable scope that proves value quickly, then expanding based on lessons learned rather than pursuing comprehensive solutions that delay benefits.