Segmented Bar Graphs: Enhancing Data Interpretation

Every data analyst and educator knows the challenge of showing how groups differ without overwhelming the audience with numbers. Segmented bar graphs provide a clear way to highlight part-to-whole relationships, making shifts in distribution easy to spot across categories. By focusing on proportions over totals, these graphs quickly reveal trends that traditional charts might hide, giving you the tools to communicate insights effectively and avoid common misinterpretations in your reports or presentations.
Table of Contents
- Segmented Bar Graphs Explained And Misconceptions
- What Makes Segmented Bars Different
- Common Misconceptions That Trip People Up
- When Segmented Bars Actually Work
- Different Types And Formats Compared
- The Main Three Types
- Orientation And Layout Decisions
- Segmented Bars Vs. Related Visualization Types
- When To Use Each Format
- Visual Construction Techniques And Best Practices
- Color Strategy That Actually Works
- Labeling And Annotation Best Practices
- Baseline And Axis Decisions
- Reducing Visual Clutter
- Practical Construction Workflow
- Key Applications In Education And Analysis
- Educational Applications That Engage Learners
- Data Analysis And Research Applications
- Making Data Accessible To Diverse Audiences
- Real-World Scenarios That Demand Segmented Bars
- Common Mistakes And How To Avoid Them
- The Axis Baseline Error
- Confusing Segmented With Stacked Bars
- Color Choices That Backfire
- The Clutter Catastrophe
- Missing Or Incomplete Labels
- Illogical Bar Ordering
Key Takeaways
| Point | Details |
|---|---|
| Segmented Bar Graphs Visualize Proportions | They illustrate how categorical data breaks into segments that add up to 100%, unlike stacked bar charts which reflect absolute values. |
| Avoid Common Misconceptions | Recognize that segmented bars show relative frequencies, not raw counts, to prevent misinterpretation of data. |
| Choose Appropriate Formats | Use simple segmented bars for proportional comparisons and grouped formats for independent subgroup analyses, choosing based on your data goals. |
| Design for Clarity | Maintain a clear, clutter-free presentation by using high-contrast colors, effective labeling, and appropriate sorting of data to enhance viewer comprehension. |
Segmented Bar Graphs Explained and Misconceptions
Segmented bar graphs are a powerful visualization tool that show how categorical data breaks down into proportions. Each bar gets divided into colored segments, with each segment representing a different category or group. The segments add up to 100% of the bar, making it easy to spot how distributions shift across different categories.
Think of them like a pie chart stretched into a rectangle. Instead of watching slices rotate around a circle, you see proportional blocks stacked horizontally or vertically. This format makes comparison between groups much clearer than traditional pie charts, especially when you have multiple groups to analyze.
What Makes Segmented Bars Different
Segmented bar charts display proportions rather than absolute values or raw counts. This is where the confusion typically starts. Many people mistake them for regular stacked bars, but the key difference lies in what they actually measure.
Here’s what sets them apart:
- Proportions over totals: Each segment represents a percentage of the whole bar, not the actual count
- 100% constraint: All segments within a bar always add to 100%
- Relative frequency focus: Shows part-to-whole relationships, not absolute numbers
- Cross-group comparison: Makes it simple to see how distributions differ between groups
Common Misconceptions That Trip People Up
Misunderstanding segmented bar graphs leads to misinterpretation of your data. Here are the most common pitfalls data analysts and educators encounter:
Misconception 1: Segmented bars show raw counts like stacked bars do. They don’t. A segment’s height tells you percentage, not quantity. If your first bar shows 40% blue and your second bar shows 40% blue, the actual blue counts could be completely different.
Misconception 2: The bar length indicates the total frequency. It doesn’t. Every bar extends to 100%, regardless of whether one group has 50 responses or 5,000. This means you lose information about sample sizes entirely.
Misconception 3: Segmented bar graphs always show absolute values. Wrong again. They show relative frequencies and percentages exclusively, focusing on distributions within categories rather than total counts.
Misconception 4: They work equally well for all data types. They don’t. These graphs shine with categorical data relationships but struggle with continuous data or when sample sizes vary dramatically.
Always check whether you need proportions or raw counts before choosing segmented bars—the wrong choice leads to seriously flawed conclusions.
When Segmented Bars Actually Work
Segmented bar graphs excel when you want to compare how categorical distributions shift across groups. Common scenarios include:
- Survey responses by demographic (age, income, location)
- Customer satisfaction ratings across product lines
- Political poll results by region
- Class grade distributions by semester
- Market share breakdown by competitor
If you need to emphasize total quantities or track actual counts, use a regular stacked bar chart instead. If you want to focus on proportional relationships between two categorical variables, segmented bars are your answer.
Here’s a reference table highlighting the ideal use cases and limitations for segmented bar graphs compared to related chart types:
| Chart Type | Ideal Use Case | Main Limitation | Best For |
|---|---|---|---|
| Segmented Bar Graph | Comparing group proportions | Hides total sample sizes | Surveys, demographics |
| Stacked Bar Chart | Showing absolute quantities | Difficult proportional comparison | Sales, population counts |
| Mosaic Plot | Visualizing group size variation | Harder to interpret proportions | Demographic distributions |
| Grouped Bar Chart | Independent subgroup analysis | Requires more space, complex legend | Competitor comparison |
Pro tip: Always include the sample size (n) for each group near the bar label—this restores the context that segmented bars deliberately hide and prevents readers from making incorrect assumptions about group magnitudes.
Different Types and Formats Compared
Segmented bar graphs come in several distinct formats, each suited to different analytical goals. Understanding which type to use depends on whether you want to emphasize proportions, compare absolute values, or track relationships across multiple dimensions. The three main formats serve different storytelling purposes.
Your choice of format directly impacts how viewers interpret your data. A horizontal layout reads left to right like text. A vertical layout follows the natural top-to-bottom eye movement. Both work equally well—pick based on available space and audience preference.
The Main Three Types
Segmented bar charts vary in layout and normalization approaches. Here are the most common formats analysts use:
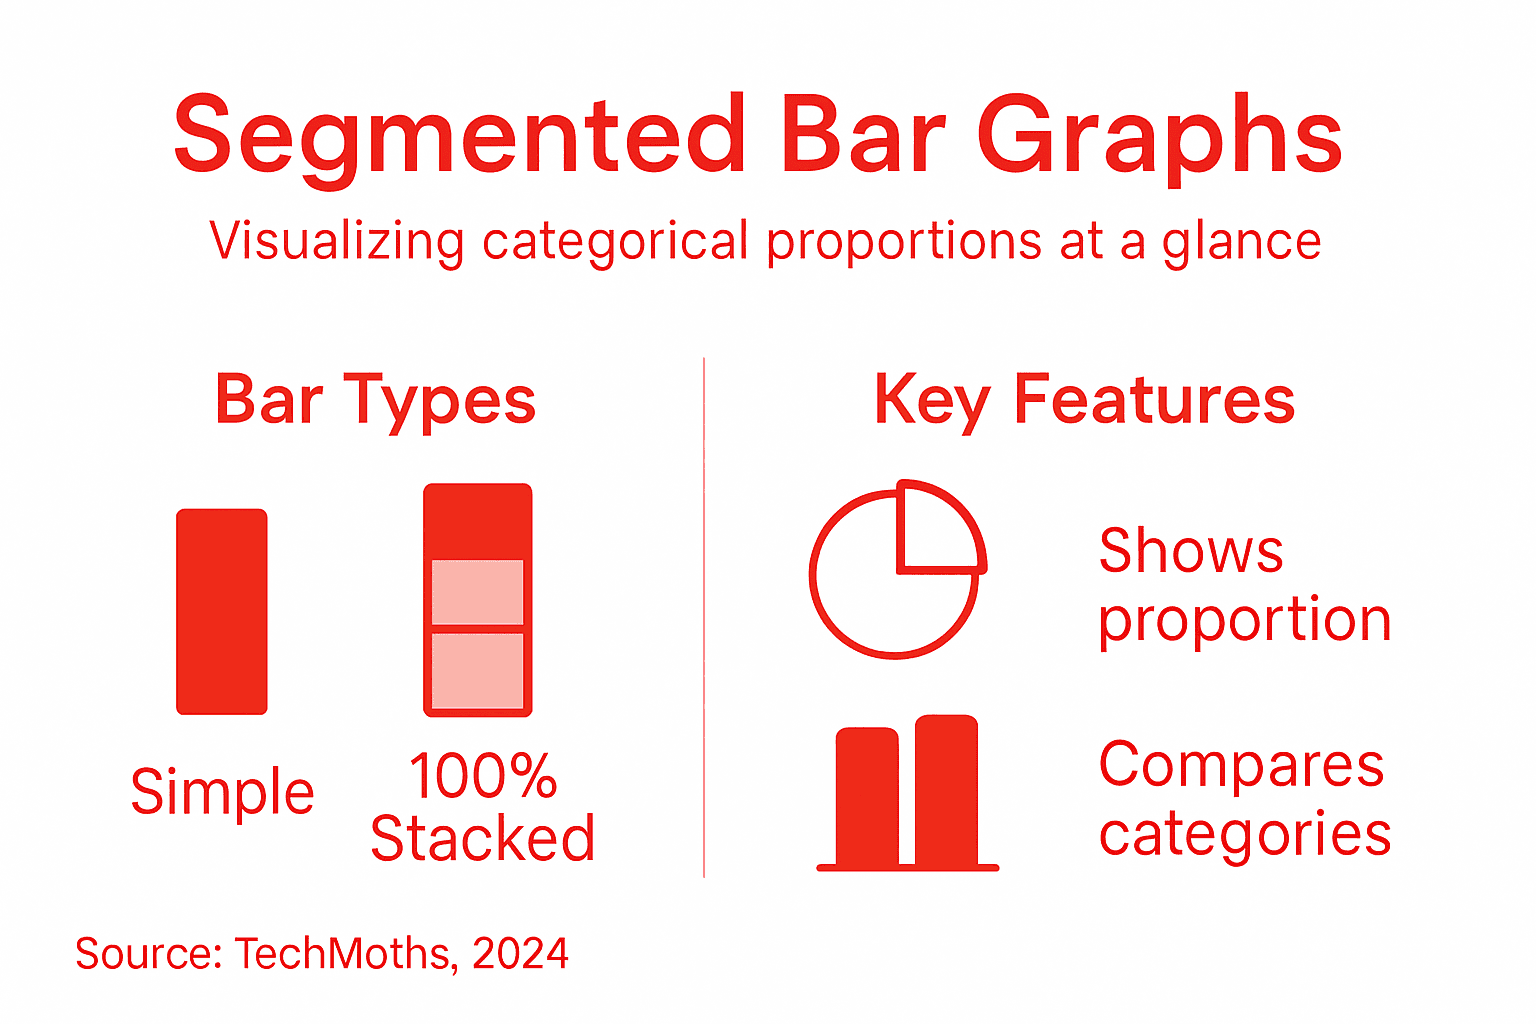
Simple Segmented Bars: Each bar divides into colored segments stacked end-to-end. The segment widths vary based on actual values within each category. Use this when absolute differences matter alongside proportional relationships.
100% Stacked Bars: Every bar stretches to identical length (100%), with segment proportions adjusted accordingly. All comparisons become purely proportional. This format normalizes each category, making distribution patterns instantly visible regardless of total sample size.

Grouped Bar Charts: Segments appear side-by-side rather than stacked. This format lets you compare sub-groups independently without forcing them into a single bar. Use this when you want to examine specific categories in isolation.
Orientation and Layout Decisions
You can orient segmented bars vertically (traditional column style) or horizontally. Choose based on these factors:
- Horizontal orientation: Better for long category labels; reads naturally for Western audiences
- Vertical orientation: Saves space; works well with 10+ categories; follows chart convention
- Multiple bars per group: Grouped format eliminates confusion when comparing segments side-by-side
Segmented Bars vs. Related Visualization Types
Mosaic plots display parts of a whole like segmented bars, but they vary bar widths to represent different group sizes. Segmented bars maintain uniform width across all bars, making them much easier to read at a glance. This consistent width is why segmented bars dominate in business presentations.
Here’s how they compare:
| Format | Best For | Strength |
|---|---|---|
| Simple Segmented | Mixed absolute and proportional data | Shows both counts and percentages |
| 100% Stacked | Pure proportion comparison | Eliminates size bias |
| Grouped Segments | Independent sub-group analysis | Easy side-by-side comparison |
| Mosaic Plots | Emphasizing group size variation | Displays sample size visually |
The right format transforms a confusing dataset into instant insight—choose based on your story, not default templates.
When to Use Each Format
Simple segmented bars work when you have 3-5 main categories with 2-4 segments each. Too many segments create visual clutter. The 100% stacked format shines when you’re comparing proportional shifts across dozens of groups—think survey data across 50 locations.
Grouped bars excel when stakeholders need to see specific segment performance independently. Market analysts love grouped formats for comparing competitor segments without forcing them into one bar.
Pro tip: Test your visualization with actual audience members before finalizing—the format that feels obvious to you might confuse your viewers, so validate readability with target users first.
Visual Construction Techniques and Best Practices
Building an effective segmented bar graph requires intentional design choices that prioritize clarity over decoration. Your visualization succeeds when viewers extract the correct insights within seconds, not minutes. This means every color, label, and bar arrangement must serve a specific analytical purpose.
Start by defining your message before touching any software. Ask yourself: what comparison matters most? What story do these segments tell? Your answer shapes every decision that follows.
Color Strategy That Actually Works
Highly contrasting colors differentiate segments without overwhelming viewers. This is non-negotiable. Avoid similar colors that blend together and destroy readability. Use a maximum of 5-7 segment colors; beyond that, your audience loses track.
Here’s what works:
- High contrast palette: Pick colors that visually separate at a glance
- Consistent order: Keep segment colors in the same sequence across all bars
- Colorblind consideration: Test your palette with colorblind simulation tools
- Avoid red-green pairs: This combination fails for roughly 8% of viewers
Labeling and Annotation Best Practices
Labels make or break interpretation. Place segment labels directly on the bar when space permits—this beats legend-hunting by miles. If segments are too narrow for internal labels, use a legend positioned nearby.
Category labels belong on the axis, with font sizes large enough for comfortable reading. Rotate horizontal labels only when necessary; tilted text slows comprehension.
Baseline and Axis Decisions
Your value axis must start at zero. This foundational rule prevents visual distortion. A false baseline exaggerates small differences and misleads viewers. Always maintain proportional representation across your entire graph.
Sort your bars strategically. Alphabetical sorting looks organized but hides patterns. Instead, sort by:
- Total bar length: Highlights which categories dominate overall
- Largest segment: Emphasizes your primary category
- Segment variation: Shows which categories have balanced distributions
The difference between a confusing chart and a brilliant one often comes down to one choice: sorting strategy and color palette.
Reducing Visual Clutter
Limit segments to what viewers can reasonably track. Avoiding similar colors and limiting segment quantity reduces clutter. Three to four segments per bar work best for most audiences. Beyond five segments, cognitive load skyrockets.
Grid lines can help with value estimation, but use them sparingly. Light gray gridlines beat bold black ones. Remove borders between segments if they don’t add clarity—they often just create visual noise.
Practical Construction Workflow
Follow this sequence when building your graph:
- Define the story you want to tell
- Choose your colors based on contrast, not aesthetics
- Sort bars to highlight key patterns
- Label segments directly on bars whenever possible
- Add annotations only for surprising insights
- Test with users before finalizing
Pro tip: Create your chart, then hide all non-essential elements (gridlines, borders, 3D effects) and ask: does removing this hurt understanding? If not, delete it—simplicity always wins.
For quick reference, here are best practices for constructing segmented bar graphs:
| Step | Purpose | Impact on Clarity |
|---|---|---|
| Start at zero axis | Avoids misleading proportions | Ensures accuracy |
| Use high-contrast colors | Distinguishes segments easily | Prevents misreading |
| Limit number of segments | Reduces cognitive overload | Makes chart faster to interpret |
| Direct segment labeling | Eliminates legend hunting | Speeds up comprehension |
Key Applications in Education and Analysis
Segmented bar graphs solve real problems across education and data analysis. They transform complex categorical relationships into visual stories that stick. When you need to compare how proportions shift across groups, segmented bars outperform most alternatives.
Your students and stakeholders grasp proportional relationships faster with segmented bars than with raw tables. This visual advantage makes them invaluable in classrooms, research reports, and boardroom presentations alike.
Educational Applications That Engage Learners
Segmented bar graphs display survey results and cross-tabulated demographic data effectively. In statistics courses, students use them to compare test score distributions across different teaching methods. History classes visualize demographic changes across decades. Psychology courses examine preference patterns by age groups.
Educators love segmented bars because they prompt real questions:
- Did proportions shift between groups? Students spot trends instantly
- Which category dominated in this group? Visual dominance stands out immediately
- How did this distribution compare to others? Side-by-side bars enable direct comparison
- What explains these proportional differences? Students develop critical thinking
Data Analysis and Research Applications
Segmented bar graphs help analysts detect trends and examine relationships between variables like age, gender, and customer preferences. Marketing researchers use them to compare brand perception across demographic segments. Healthcare analysts track treatment outcome distributions across patient populations.
Common analytical uses include:
- Market segmentation: Compare product preference by geographic region or income level
- Healthcare outcomes: Track treatment success rates across patient demographics
- Employee surveys: Visualize satisfaction levels by department or tenure
- Customer satisfaction: Compare Net Promoter Score distributions across customer segments
- Academic performance: Examine grade distributions across different student populations
Making Data Accessible to Diverse Audiences
Segmented bars bridge the gap between raw data and actionable insight. Non-technical stakeholders understand them immediately—no statistical background required. Board members see proportional shifts at a glance without needing explanation.
This accessibility matters enormously. A report with segmented bars gets acted upon. A report with data tables sits ignored. Educators who want students to understand relationships teach with segmented bars, not spreadsheets.
Real-World Scenarios That Demand Segmented Bars
Consider a survey asking students about study preferences: in-person, online, or hybrid. A segmented bar for each university shows immediately how student preferences differ by institution. Another example: comparing customer satisfaction (very satisfied, satisfied, dissatisfied, very dissatisfied) across product lines reveals which products need improvement.
Segmented bars succeed when your story is about proportions changing across groups—use them for that purpose and your audience gets it instantly.
Researchers often face the choice between complicated statistical tables and visual simplicity. Segmented bars offer visual simplicity without losing analytical rigor. This makes them perfect for research papers, dissertations, and conference presentations where clarity determines whether your findings influence anyone.
Pro tip: When presenting to educational or business audiences, always pair segmented bars with the sample size (n) for each group—this prevents viewers from mistaking proportional shifts for real-world differences when group sizes vary dramatically.
Common Mistakes and How to Avoid Them
Segmented bar graphs fail when designers prioritize aesthetics over clarity. Most mistakes stem from preventable choices that undermine your message. Learning what trips up others protects your visualizations from the same pitfalls.
The good news? These errors are fixable. Understanding them transforms your graphs from confusing to compelling.
The Axis Baseline Error
Starting your Y-axis above zero is perhaps the most dishonest mistake you can make. This distorts proportions and exaggerates differences that barely exist. Your viewers unconsciously absorb false urgency from the manipulated scale.
The fix is simple: always start at zero. This maintains honest, proportional representation. Every segment size reflects actual data relationships without visual trickery.
Confusing Segmented with Stacked Bars
Many analysts mix up these formats. Segmented bar charts normalize each bar to 100%, while regular stacked bars show absolute values. Confusing them destroys your entire analysis.
Here’s the critical difference:
- Segmented bars: All bars reach 100%; focus on proportions
- Stacked bars: Bar heights vary; focus on totals
- Choose segmented when: Comparing distributions across groups matters
- Choose stacked when: Total quantities matter more than proportions
Color Choices That Backfire
Overloading charts with too many colors and using similar hues prevents clarity. Your audience’s eyes blur when adjacent segments share similar tones. They give up trying to distinguish them.
Color mistakes to avoid:
- Using red and green together (colorblind viewers can’t differentiate)
- Adding more than 5-7 segment colors per chart
- Mixing bright and pastel colors in the same graph
- Choosing colors solely for aesthetic appeal
The Clutter Catastrophe
Too many segments per bar overwhelms viewers instantly. Beyond five segments, cognitive load explodes. Your audience stops trying to track differences and tunes out entirely.
When you have many categories, group smaller ones together as “Other.” This preserves detail where it matters most while maintaining scannability. Your visualization becomes usable again.
Missing or Incomplete Labels
Omitting axis labels forces viewers to guess what they’re seeing. Forgetting data values means they can’t verify proportions. These gaps breed misinterpretation.
Label everything that matters:
- Category labels: Clear, legible, properly sized
- Axis titles: State what you’re measuring
- Segment values: Include percentages or counts directly on segments when space allows
- Legend: Position nearby; use clear language
Illogical Bar Ordering
Arranging bars alphabetically looks organized but hides patterns. Sorting by total bar length, largest segment, or variation reveals the story your data actually tells.
The difference between a readable chart and a confusing one often boils down to one decision: how you sort the bars.
Think about what comparison matters most. Sort accordingly. Your audience will spot insights immediately instead of hunting for meaning.
Pro tip: Before finalizing your chart, ask yourself: could I remove any element and still communicate the same insight? If not, that element stays; if yes, delete it ruthlessly.
Master Data Storytelling with Clear Visual Insights
If you find yourself struggling to communicate complex data clearly, especially when interpreting proportional relationships in categories, the challenges highlighted in the article about segmented bar graphs are all too familiar. Key difficulties such as confusing raw counts with percentages, choosing the right graph format, and preventing visual clutter can make your data presentations fall flat or even mislead your audience. Understanding concepts like 100% stacked bars, proper color strategies, and effective labeling are crucial steps toward making your insights stand out.
At TechMoths, we understand that data visualization is not just a technical skill but a vital tool to enhance learning and decision making across education, business, and lifestyle topics. Explore carefully crafted guides and actionable tips on topics related to education, personal development, and business communication that can boost your ability to tell powerful stories with your data.
Ready to elevate your data interpretation skills and avoid the pitfalls of common graphing mistakes? Visit TechMoths for expert advice and fresh perspectives that make complex topics accessible and engaging. Unlock the potential of your data by learning to present it with clarity and confidence today. Dive into our educational resources and broaden your understanding at TechMoths. Your next breakthrough in data storytelling is just a click away.
Frequently Asked Questions
What are segmented bar graphs used for?
Segmented bar graphs are primarily used to compare proportional distributions among different categories, allowing for clear visual comparisons across groups.
How do segmented bar graphs differ from stacked bar graphs?
Segmented bar graphs show proportions that add up to 100%, focusing on relative frequencies, whereas stacked bar graphs display absolute values and can vary in total height.
What are the common misconceptions about segmented bar graphs?
Common misconceptions include confusing segmented bars with stacked bars, believing they show raw counts, or assuming they are suitable for all data types, when they actually excel with categorical data.
When should I use a segmented bar graph instead of other chart types?
Use a segmented bar graph when your primary goal is to highlight proportional relationships between categorical variables and compare how these proportions shift across different groups.